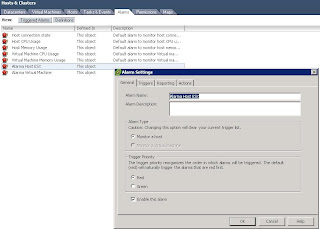
A feature that VMware VI3 offers and that is definitely worth the ten minutes it takes to configure are the alarms. VMware VI3 gives us the opportunity to receive alarms (via a script) or be notified (by mail, SNMP) for changes in certain parameters of our VM.

The alarms indicate the status of objects, which can be: folders, datacenters, clusters, resource pools, and hosts and VMs. In fact, on the left side of the VMware Virtual Center, you can see these objects and their hierarchy.
The first thing we have to do is decide what level we want to set the alarm that we are going to configure at. Personally, I felt comfortable setting mine to Clusters & Host. In this way, setting a couple of alarms is enough for all of my VMs. If one particular VM or parameter that is not specifically monitored with the above-mentioned alarms interests me, I can set another alarm for it. This, however, does not happen often.
There are only two alarms that I would like to set for Hosts & Clusters: one type is an Alarm Host and the other is an Alarm VM. This will allow me to know what is happening to the Hosts and VMs I have in my virtual infrastructure.

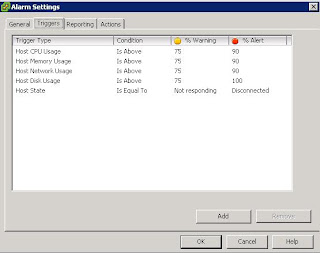
For example, I add the Alarm Host and I select the triggers that I want (Note:In every field, there is a drop-down menu):

And I select the notifications that I want—in general, by mail. For this we must first define the SMTP server. (In the VMware VI3 Virtual Center, Menu Administration, Virtual Center Management Server, Configuration, Mail)
Here is an example of mail that arrives. In this case, it was sent due to excessive CPU use:
Target: VirtualMachine1Old Status: GreenNew Status: YellowCurrent value: Alarm Virtual Machine – (Metric CPU Usage (Average / Rate) = 76% OR Metric Memory Usage (Average / Absolute) = 12% OR Metric Network Usage (Average / Rate) = 0 % OR Metric Disk Usage (Average / Rate) = 0% OR State = Powered On) Alarm: Alarm Virtual Machine ([Yellow Metric Is Above 75%; Metric Network Is Above 90%] OR [Yellow Metric Is Above 75%; Network Metric Is Above 90%] OR [Yellow Metric Is Above 75%; Metric Network Is Above 90%] OR [Yellow Metric Is Above 75%; Metric Network Is Above 90%] OR [Yellow State Is Equal To suspended; Is Red State Equal To poweredOff]) Description: Alarm Alarm Virtual Machine on VirtualMachine1 changed from Green to Yellow
Important:
In the triggers, as well as in the CPU and Memory, set the threshold to %.
In indicators for disk and network use, there is a bug (at least in version 3.0.2). The numbers are not expressed in %; rather, for the disk, the number is in “kiloBytesPerSecond” and for the network it is in “kiloBitsPerSecond”.
Thanks to Kurrin for inspiring this article.