I have noticed many partners lately complaining about their Capacity Planning report having below expected VM per server Density, & has normally been granted access to their Capacity Planning Project to optimize the report. I have decided I will share the info on here on which parameters to change in order to get a decent VM per Server Density in your CP report. Although I have been using these numbers successfully During my job for a while, and I know that many of my colleagues are following the same I provide no explicit/implicit guarantee of the results nor my employer. If you think your capacity planner report got out of hand on results (Ex 1000 vm per host), then please check what you have done wrong or contact your local VMware SE, or feel free to leave me a comment below. I will repeat use at your own risk, & ensure to use your judgement before submitting the report to customers.
Bumping up CP consolidation ratios Procedures:
1- First Make sure you are using Consolidation Analysis (CA) rather than Consolidation Estimate (CE) before you follow up any of the below procedures, else you will never find out the required tabs. You can always choose to run Consolidation Estimate (CE) when first creating the CP project in VMware Capacity Planning, but what if you already have a project running as Consolidation Estimate (CE) then you can follow the below procedure to convert it to Consolidation Analysis (CA).
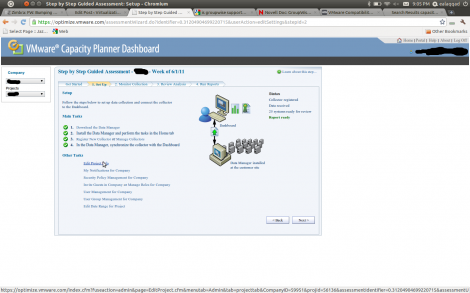
a- From the Setup Page in your Consolidation Estimate click on Edit Project Info as shown in the Screen Snapshot below

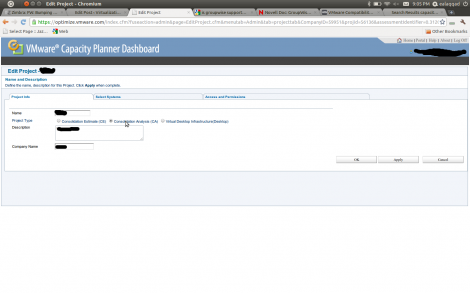
b- In the Capacity Planning Dashboard Edit Project Info Page choose Consolidation Analysis (CA) & Hit OK as illustrated in the below screen snapshot

Now that you have Switched to Consolidation Analysis (CA), you should be able to change the require parameters for a better consolidation ratio report as below. Before you follow the step below make sure you have chosen the Company & the project under projects in the top left site of the CP dashboard.
1- It seems the default set target system thresholds for paging rate and file cache are set quite low, and for a better consolidation ration you should bump them up as below:
paging rate 200 page faults/sec ==Change to==> 10,000 pages/seconds
File Cache 600MB ==Change to==> 2147MB
Below are the steps to make the changes and get updated reports:
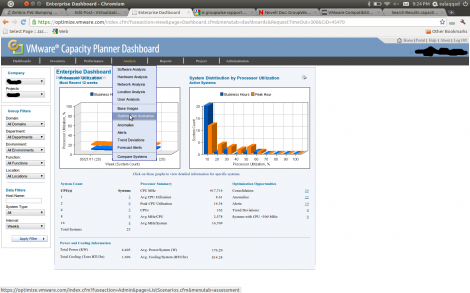
a. Go to Analyze->Optimization Scenarios and edit each of the 2 builtin scenarios (they both start with ***)

b. Go through the wizard and edit the numbers on the Systems Thresholds screen (see attached screenshot)
c. Force the scenarios to be run again (click the checkbox next to the scenario and hit Run)
d. Rerun the optimization reports
This makes sense according to how ESX manages memory – each VM has its own paging file, and its own paging threshold in CP. So, the logic behind having a consolidated paging rate doesn’t make much sense.
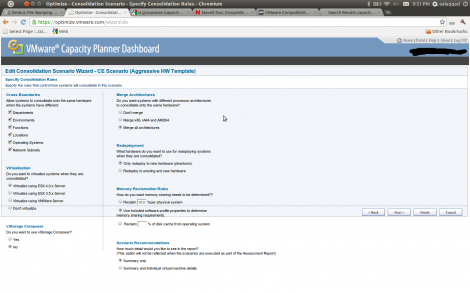
When Editing your scenarios you will be presented with Specify Consolidation Rules page. On this page make sure you choose “Merge all architectures” as well all the options under “Cross Boundaries” as shown in the screen shot below, unless you have a special reason to do otherwise.

Further recommended values for all of the parameters are:
· Processors: CPU Usage % – 60 (same as default)
· Processors: Queue – 4 (same as default)
· Memory: RAM Usage % – 90 (same as default)
· Memory: Page File Usage % – 100 (default is 70%)
· Memory: Paging – 10000 (default is 200)
· Memory: File Cache – 2147 (default is 600)
· Disk: Speed – 50 (same as default)
· Disk: I/O Speed – 5000 (default is 1000)
· Network: Speed – 1000 (default is 10)
I hope this help, & please leave your feedback in comments.
